Troubleshooting with Wireshark [Riverbed lab kit]

A while ago I attended a Wireshark webinar from Riverbed in which they presented the tool, some beginner and intermediate users troubleshooting scenarios and some lab kit.

Now I got an e-mail that they made it available for download at http://www.riverbed.com/wireshark-virtual-tour

Part of this Lab Kit were available in the Virtual World Tour 2014 webinar on Troubleshooting with Wireshark, held by Laura Chappell and Gerald Combs.

Kit is a free collection of Wireshark training, trace files and tips and tricks for troubleshooting your network. This lab kit contains the following:

  • Nine Network Analysis Training videos
  • Troubleshooting Checklist
  • Sample Network Analysis Report
  • Practice Trace Files
  • Laura’s Wireshark Troubleshooting Profile
  • Chapter Excerpts from Laura Chappell’s new book “Troubleshooting with Wireshark Locate the Source of Performance Problems”

  • If you are interested in troubleshooting with Wireshark, I think this would be a nice place to start. The presentation page of Wireshark Virtual Tour looks a little bit like comics marketing style, but the materials are pretty good.

    Live digital threats

    I wanted to bring these free tools to my blog to keep track of them, as most probably I will forget about, and to share with anybody interested in gathering information in the security areas.

    First tool was revealed to my in tweet from Greg Ferro:

    https://twitter.com/etherealmind/status/392606499044098049

    As usually I trust his words, I said to give it a try. I can tell that this tool is very interesting. According to the explanation found on http://www.digitalattackmap.com/faq/ :

    The Digital Attack Map presents data gathered and published by Arbor Networks ATLAS® global threat intelligence system. ATLAS sources its data worldwide from 270+ ISP customers who have agreed to share anonymous network traffic and attack statistics. Data is updated hourly and can also be found in Arbor’s ATLAS Threat Portal.

    Below you have an embedded version of this map, but better access the Digital Attack Map website.

    Second tool caught my attention from the Digital Attack Map explanation and it’s called Arbor’s ATLAS Threat Portal.

    Atlat Threat Portal

    This tool is explained as:

    The ATLAS portal today is a public resource that delivers a sub-set of the intelligence derived from the ATLAS sensor network on host/port scanning activity, zero-day exploits and worm propagation, security events, vulnerability disclosures and dynamic botnet and phishing infrastructures.

    If the first tool is related to network attacks, the second one is covering more topics like botnets, phishing, scans and more.
    You can access Arbor’s ATLAS Threat Portal here.


    Packet header graphic representation

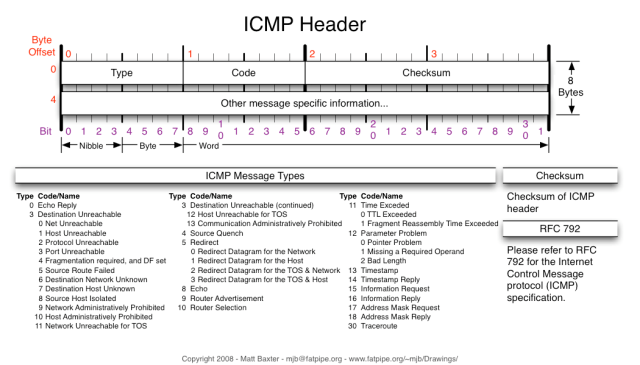
    I was surfing the Internet in search of some good drawing representing packet header and I come across five excellent diagrams large enough ( 1050px wide ) to use digital but also for printing. The person behind these excellent drawings is Matt Baxter, but his site (fatpipe.org) is not accessible anymore. I found these documents on the Internet and I thought to add them here together.

    You will find a link at the bottom of this post where you can download them all together.

    Disclaimer: These drawings are not mine and I don’t claim any rights on them. My thanks and all copyrights go to Matt Baxter.
    Matt, if you come across this blog and you find sharing to be inappropriate, please contact me.

    IPv4 Header

    IPv4 Header

    IPv6 Header

    IPv6 Header

    TCP Header

    TCP Header

    UDP Header

    UDP Heater

    ICMP Header

    ICMP Header

    Download all drawings here:

    Packet header representation


    Draw network diagrams online (with Cisco stencils)

    I’m a Mac and Linux user and if you are like me, then you have the same problems drawing network diagrams. Microsoft Visio does not have a version for this platforms. I’m not saying that there are no alternatives to Visio on Mac or Linux platform, but most of them are either limited in features, expensive or need some tricks to use it (as I described in one of my early post).

    Finally I’ve found something that is:
    – accessible (free or paid, but decent prices)
    – online
    – allow me to use Cisco stencils (not all, but at least a decent set of them)
    – import / export Visio .vdx files (for paid version; I would like to have it for free or for Personal plan, but they have to make some money, isn’t it?)
    – allow me to save the work in .pdf, .png or .jpeg format

    The application is brought by LucidChart.com. I’ve found some other applications online, but I consider this to be the best so far.
    I’m using the free version for now, but I’m thinking to buy paid account, especially for the Visio import / export features. As said above the prices are decent:

    [adsense_id=”1″]

    LucidChart.com may be used for more than just network diagrams, but I’m writing about this kind of drawing as is the most important for me now. Since a picture worth a thousand words, here is a small screencast that I made to show you how it works. No words (I don’t like how my recorded voice sounds) but you can see how a new network diagram is created from start to the point where I can save and use it outside LucidChart.com

    P.S. I’m not affiliated in any way to LucidChart.com, the links are not part of any affiliate program and I’m not paid to write this post! I just want to share with you something that I find useful for network engineers.

    [adsense_id=”4″]

    Etherape – Real time network topology and traffic flow

    There are numerous reasons why you would want to watch your network topology or the flow of traffic on your network. Say you are experiencing a bandwidth bottleneck. What is causing that bottleneck? Is it a particular user? A machine gone awry? How do you find out what is happening without having to walk around to every single machine on your network? Easy. The Etherape network monitor gives you a real-time graphical display of your network and the flow of traffic. Using this tool you can easily pinpoint suspect machines. Let’s take a look at exactly how you can use this tool to troubleshoot networking issues.

    Installation

    Etherape is only available for UNIX and UNIX-like OSs (such as Linux and even OS X). In order to use Etherape you will need:

    • libpcap
    • GTK+
    • Libglade 2
    • GNOME
    • Standard resolver library (name depends upon OS)

    Read more here…