How to emulate ASA in Ubuntu 9.10 and GNS3

Cisco ASA

Brainbump.net has an excellent and very complete how to emulate ASA using just the following components:

  • Ubuntu 9.10 – 32 bit Edition
  • GNS3 v0.7 RC1 tgz
  • Dynamips 0.2.8-RC2 binary for Linux x86 platforms
  • Qemu-0.11.0 tar.gz
  • Qemu-0.11.0 Patch
  • ASA Binary Version 8.0(2) – (asa802-k8.bin)

How-to is divided in 3 video tutorial parts for easy understanding and start with the most basic installation on GNS3 under Ubuntu 9.10 and continue with the actually configuration on the emulation.
If you are interested in security or you just want to test ASA and don’t have access to real hardware you definetely will want to try Brainbump.net tutorial.

READ THE FULL TUTORIAL on Brainbump.net


Free Netflow Analyzer software

For today, I put together a list with the software that I’m using when I’m testing network behavior in the lab. The software below is free, with some restrictions but is perfect to use it when you need a quick solution to monitor your network with Netflow, sFlow or jFlow.

All the proposed software have commercial version, so if you like then and you consider one for your company please get in touch with the company that develop them for more information about licenses.

sFlowTrend

Free, graphical network monitoring tool. sFlowTrend makes use of the popular sFlow standard to generate real-time displays of the top users and applications making use of network bandwidth.

Some features:

  • Quickly understand who is using the network and what they are doing.
  • Enforce corporate acceptable network use policies.
  • Rapidly identify the cause of any problems or abnormal traffic.
  • Understand trends in usage and accurately target upgrades.
  • Generate management reports on current and historical performance.

sFlowTrend is written in Java and will run on most platforms.

Download sFlowTrend.

Solarwinds Netflow Analyzer

Solarwinds Real-Time NetFlow Analyzer captures and analyzes NetFlow data in real time to show you exactly what types of traffic are on your network, where that traffic is coming from, and where it is going. It displays inbound and outbound traffic separately for granular analysis that makes problem diagnosis quick and easy. You can view the historical NetFlow data broken out by application, conversation, domain, endpoint, and protocol. That way you know exactly how your bandwidth is being used and by whom.
Features:

  • Investigate, troubleshoot, and quickly remediate network slowdowns
  • Easily identify which users, devices, and applications are consuming the most bandwidth
  • Isolate inbound and outbound traffic by conversation, application, domain, endpoint, and protocol
  • Personalize NetFlow data displays to view traffic by specified time periods (up to 60 minutes) and by traffic type
  • Customize refresh rates and display units for NetFlow traffic

Drawback for this free version is that it can record only up to 60 minutes, than you have to restart software to record again.

Available only for Windows platforms.

Download Solarwinds Netflow Analyzer

ManageEngine Netflow Analyzer

ManageEngine NetFlow Analyzer is a, web based (no hardware probes), bandwidth monitoring, network forensics and network traffic analysis tool that has been optimizing thousands of networks across varied industries for peak performance and helping them to put their bandwidth for a better use. NetFlow Analyzer is a NetFlow, sFlow, JFLow (and more) collector, analyzer and reporting engine integrated together.

Features:

  • Real-time visibility into top applications and talkers in the network.
  • Detection of unauthorized WAN traffic.
  • Identify virus, worms and DoS attacks in real-time.
  • Understand the history of security violations with alert reports.
  • Recognize applications that use dynamic ports by performing a deep-packet inspection using Cisco NBAR.
  • Real time reports with 1 minute granularity.
  • Aggregated data stored for ever for historic reports
  • Ability to view reports in different granularity – 10 min, hourly, daily, weekly, monthly, and custom time period.

The bad aspect is that you can use it only for 30 days. Then you have to buy it. There is a trick, that if you reinstall the product you can use it again for 30 days. I advice to use this trick just for personal use or for testing purpose.

Available for Linux and Windows.

Download ManageEngine Netflow Analyzer

Plixer Scrutinizer

Plixer Scrutinizer captures Cisco NetFlow, sFlow and other flow technologies and uses that data to monitor the overall network health. Reports on which hosts, applications, protocols that are consuming network bandwidth.

Custom NetFlow Reports allow you to filter (include/exclude) in on exactly the information you need. They can be saved and run again later.

Features:

  • Adds several additional traffic analysis Report Types (e.g. Flows, Flow Volume, NBAR Support, etc.).
  • Report on Top Applications, Conversations, Flows, Protocols, Domains, Countries, Subnets, etc., across dozens of routers and switches.
  • Any saved report in Scrutinizer can be configured with a threshold to trigger an alarm.
  • DNS resolution becomes automated and a constant process.
  • Network traffic reporting and alarming on the internal network: SYN, NULL, FIN, XMAS Scans, RST/ACK worms, P2P, ICMP Unreachable, illegal IP addresses, excessive Multicast traffic, known compromised Internet hosts and more.

The bad part is that it drops the database after 24 hours. Still you can save the databases before this are dropped by the free version of Scrutinizer.

Available for Windows platforms.

Download Plixer Scrutinizer

Do you have any other alternatives that can help network engineer test their environment? Feel free to suggest in the comments form and if they are good I will add them to  this post.

GNS3: OSPF and EIGRP scenario

A ready made GNS3 topology, including 3 interconnected routers in different domains (EIGRP and OSPF) like in the topology below.

Requirements:

– GNS3 or Dynamips install and functional
– Cisco IOS image for 3640 platform with Advanced IP Services

What’s included in the archive:

– routers initial configs
– network diagram
– GNS3 (or Dynamips) config file*
* Check the GNS3 config file for direction

What can you test with this scenario:

– ospf area range command
– ospf summary address command
– advertise loopback interfaces with /24 netmask
– redistribution between OSPF and EIGRP

Load the .net file in GNS3 / Dynamips, apply initial router configuration and you should have working scenario with OSPF and EIGRP routing.

{filelink=1}

How to integrate GNS3 with VirtualBox

The best method to test a solution that you want to implement is to real see how it’s performing with some real traffic. GNS3 or Dynamips are very good at emulating a network topology  but unfortunately they cannot assure you with the tools capable to test the environment you just create.

In one of my old posts I showed how to integrate Virtual PC with GNS3, but the problem is that with Virtual PC you can just test basic stuff. For example, you cannot simulate VoIP traffic with Virtual PC in case that you want to test some QoS marking and classification.

Here comes into play VirtualBox, a powerful x86 and AMD64/Intel64 virtualization product for enterprise as well as home use. Not only is VirtualBox an extremely feature rich, high performance product for enterprise customers, it is also the only professional solution that is freely available as Open Source Software under the terms of the GNU General Public License (GPL).

The integration on GNS3 with VirtualBox is not a hard thing to do, but you just have to be carefully in step implementation as if you skip one the solution will not work. For this solution I used Linux as host platform, so the steps works perfect under Ubuntu OS, but I’m sure that with some basic knowledge you can do it in Windows or MacOS.
Before we begin let’s summarize what you need:

Linux platform
VirtualBox installed
GNS3 installed

I assume that all 3 components are installed and working properly.  Next follow the steps below:

1. Bring up 2 or more (depending how many virtual OS you want to connect)  TAP interfaces on your Linux platform. I will go with 2 interfaces:
VirtualBox + GNS3 Step1

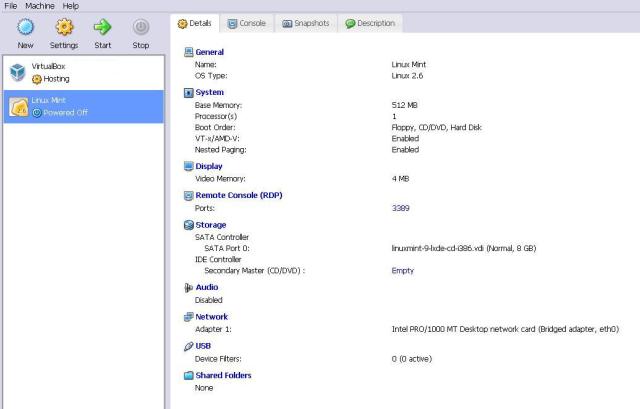
2. Configure the network interfaces of the Virtual OS in VirtualBox. I have 2 interfaces / Virtual OS. One interface is bounded to my physical network card (eth0) and I use this to connect to Internet in case that I need to download something, updates and so on… The second interface I use to connect to GNS3 virtual environment. Other settings of Virtual OS can be configured as you wish:
VirtualBox + GNS3 Step 2

3. Power on your Virtual OS Machines. In this moment if you didn’t bring the TAP interface up (Step 1), VirtualBox will issue an error and will refuse to start the Virtual Machines:
VirtualBox + GNS3 Step 3

4. Start GNS3 and build a network topology like the one in example below. You don’t have to follow exactly the same topology, but this is a good start to see that you are handling well the integration between Virtual Box and GNS3. In the example below and in regard to my Virtual Machine the Ubuntu-c = Uclient cloud and Ubuntu-s = Userver:
VirtualBox + GNS3 Step 4
5. Connect the routers R1 and R2 one to each other and to the Userver and Uclient clouds. On the routers the interface connection to cloud will be a (Fast)Ethernet and the clouds network interfaces have to be bounded to the TAP interfaces created on Step 1. Check in the images below how to do this:
VirtualBox + GNS3 Step 5

VirtualBox + GNS3 Step 5

In the end it should look something like this:
VirtualBox  + GNS3 Step 5
Now you should have an integration between GNS3 and VirtualBox. Please take into consideration the following advices before complaining that it’s not working:

– For end to end connectivity, you need to have a converged network. This means that you need to implement some kind of dynamic or static routing on your routers in order to have the end peers capable of reachability
-If you followed exactly my tutorial, and in Step 2 you configured 2 network interfaces per Virtual Machine, then you need to take care of the local IP routing. Usually in LAN network (with DHCP) the Virtual Machine interface bounded to the physical network interface will receive an IP address and also a default gateway. As an example, you can imagine that if you do no a have a static route on Userver pointing to R1 interface to reach Uclient, then all the packet will be forwarded to default gateway resulting in a issue in communication in virtual environment.
-Finally, take care when you configure the Clouds in GNS3 when assigning the TAP interfaces not to have a mismatch between Cloud – TAP interface – Router interface.

Great tool for testing QoS implementation

After my last post, some readers were asking what tool did I used for testing the QoS and how satisfied I’m with it.

The name of the tool is Packgen. According to its developer developers, “Packgen is a simple network packet generator handling diffserv markers, useful for testing network bandwidth and QoS.” It support features like:
– Network packet flows generation with given bandwidth (packets sent at each time interval depending on the bandwidth to produce and the size of the packets to generate);
– UDP and TCP flows;
– DSCP marking;
– Log generation which gives the possibility to compute statistics on the flows (to come later).

The main difference between IPerf (which is also a great testing tool, especially for bandwidth, jitter, packet loss tests…) and Packgen, is that the last one support diffserv marking natively. Of course you can achieve the same results with IPerf, with and ACL and inbound marking of the packets matched in the access-list, but with Packgen this is straight forward.

I had a little issue when downloading this tool, as the first result in Google search engine directed me to a page with no download link: http://packgen.rubyforge.org. This contains all the needed information about features, installation and how to use it (actually one of the best README that I ever saw for such tools), but no suggestion where to download the package. I search a little bit and you can download it from this official link.

To install this tool, you need to have Ruby on your system and then just run from inside the unpacked Packgen folder:

ruby ./setup.rb

Now some words about how to use it. From my post about AutoQoS, you can see that you need at least one client and one server. This 2 devices, use different files with Packgen (Don’t worry as the files come in the source package and if not, it’s very easy to create them).
First the server file, called listen.yml (if you create it, you can give whatever name you want) looks like this:

LISTEN:

udp:

ports: !ruby/range 17000..17002
tcp:

ports: !ruby/range 5002..5004

As you can see, there are 2 sections defined for UDP and TCP traffic. Then with “!ruby/range” you define a range where the server will listen. However, you can also simply use an Integer port number.

Then on the  client side, there is file called sent.yml:

SEND:

udp:

name: Voice
host: 10.10.10.100:17000
bandwidth: 700Kb
packet_size: 252B
dscp: ef
from..to: !ruby/range 0.0..60.0

name: Video
host: 10.10.10.100:5002
bandwidth: 2.8Mb
packet_size: 750B
dscp: cs4
from..to: !ruby/range 10.0..60.0
tcp:

name: Best Effort
host: 10.10.10.100:5002
bandwidth: 3.2Mb
packet_size: 1KB
from..to: !ruby/range 20.0..60.0

name: Background
host: 10.10.10.100:5002
bandwidth: 3.2Mb
packet_size: 1KB
dscp: cs1
from..to: !ruby/range 30.0..60.0

Here it’s a little bit more complex, but still human readable. This file also have 2 sections for UDP and TCP traffic, with the following paramters being defined:

-name: I believe it say everything
-host: ServerIP:port
-bandwidth: bandwidth to simulate
-packet size: packet in size in B, KB
-dscp: value
-from..to: !ruby/range: time intervals

After everything is defined, you just have to run Packgen to test.
On Server side first:

packgen -i listen.yml

Then on Client side:

packgen -i sent.yml

Optional you can add the -l file option, which will log the traffic send:

1258663872.6248 SEND dest=10.10.10.100:16385
1258663882.62591 SEND dest=10.10.10.100:5001
1258663895.65219 SEND dest=10.10.10.100:5002
1258663905.66876 SEND dest=10.10.10.100:5003
1258663933.72797 STOP dest=10.10.10.100:16385

or received:

1258663869.80496 LISTEN port=16384 proto=udp
1258663869.81079 LISTEN port=16385 proto=udp
1258663869.81441 LISTEN port=5002 proto=tcp
1258663869.81506 LISTEN port=5003 proto=tcp
1258663872.5886 RECV sent_at=1258663872.64102 flow=0 size=252 id=6
1258663872.58893 RECV sent_at=1258663872.64613 flow=0 size=252 id=7
1258663872.58903 RECV sent_at=1258663872.64719 flow=0 size=252 id=8
1258663872.58915 RECV sent_at=1258663872.65052 flow=0 size=252 id=9
1258663872.58924 RECV sent_at=1258663872.6742 flow=0 size=252 id=10

The configuration files and logs excerpt were from my AutoQos test. If you have any issues with using it, please contact me, or just check in details the documentation from developers site.