How to analyze Cisco NetFlow with FREE tool

NetFlow is a network protocol developed by Cisco Systems to run on Cisco IOS-enabled equipment for collecting IP traffic information. It’s proprietary and supported by platforms other than IOS, such as Juniper routers or FreeBSD and OpenBSD. Cisco routers that have the Netflow feature enabled generate netflow records; these are exported from the router in User Datagram Protocol (UDP) or Stream Control Transmission Protocol (SCTP) packets and collected using a netflow collector. Other vendors provide similar features for their routers but with different names Jflow or cflowd from Juniper Networks, NetStream from Huawei Technology or Cflowd from Alcatel-Lucent. Since my knowledge is mainly in Cisco’s devices area, I will focus on Netflow. A NetFlow record can contain a wide variety of information about the traffic in a given flow, like Version number, Sequence number, Input and output interface indices, Number of bytes and packets observed in the flow, Source & destination IP addresses, Source and destination port numbers, IP protocol, ToS and other… By analyzing flow data, a picture of traffic flow and traffic volume in a network can be built. Cisco Netflow have multiple version from which v5 is the most used at the moment being.

After this brief explanation of what is Netflow, let’s focus on the topic of this article. Lately I was searching for a tool that can analyze NetFlow flow and return to me an acceptable picture of what’s going on in the network. There are a lot in the market and I tried many of them, which offers free trials (maybe someday I will write some reviews about them), but for now I was really searching for something without any cost involving as it was for my private use.

The NetFlow analyzer software that I was looking for, should  be able to:
1. Display graphical format of traffic (graphs, picture…)
2. Allow me to analyze as many devices / interfaces I want
3. Allow to export some reports based on the network activity collected
4. …and the most important for me, to be FREE

As I said before, I tried some tools, with great capabilities (e.g. NetFlow Analyzer from ManageEngine) but they were having limitations that disturbed me (e.g. limitation to only 2 interfaces on the tool from ManageEngine).  Searching, I arrived to Scrutinizer NetFlow Analyzer produced by Plixer International. This tool offers exactly what I was searching for, and it is free. Now the ugly part (there is always a part like this…) is that the tool is keeping all information for 24 hours. The good part is that you can export logs on a daily basis (24 hours). E.g I had to monitor traffic for some device for 72 hours, so daily I have exported the logs and the end of the monitoring period I compared all the data. Well, it’s not so nice this limitation of 24 hours. I would prefer 48 or 72 hours, because usually this is the minimum time for monitoring a connection, device or interface. If you buy a license all this limitations are removed. As I said from begining I was searching something for private use…so, this tool was perfect for me. Anyway I believe big companies can afford to buy this tool if they test it and see that fit with their needs.

Anyway, skipping over this 24 hours limitation, the tool give you the ability to gather information from as much devices / interfaces as you want. The reports are presented in nice graphical format, with lots of details. You can download Scrutinizer NetFlow Analyzer from their site, by clicking here. On the download page, you will have the possibility to download the free version (with 24 hours limitation) or the trial version which will give you all features for a certain limited period of time. For the trial version you have to complete a form and they will issue you a trial license.

For an example how to do a basic netflow configuration on a Cisco router and how to operate Scrutinizer Netflow Analyzer please see the presentation below. For the test environment I used an old Cisco 2600 router and my notebook with Scrutinizer Netflow Analyzer installed.

Please note before watching this presentation: FirstDigest.com is not affiliated in any way with Plixer International and ManageEngine and this is not a “pay per post” article. I just wanted to share with you something that I belive it can be useful.

scrutinizer netflow analyzer

GNS3: How to create Frame-Relay Hub and Spoke lab

When I first came in touch with GNS3 I had not idea how to work with it. Not because it is so complicate to operate, but because I didn’t saw any software like this one. GNS3 and Dynamips make a very good job together, allowing users to emulate a lot of network scenarios with different topologies. If using only Dynamips suppose that you edit all the configuration file manually in text mode, now with GNS3 you can drag and drop devices, connections and configure them on the fly.

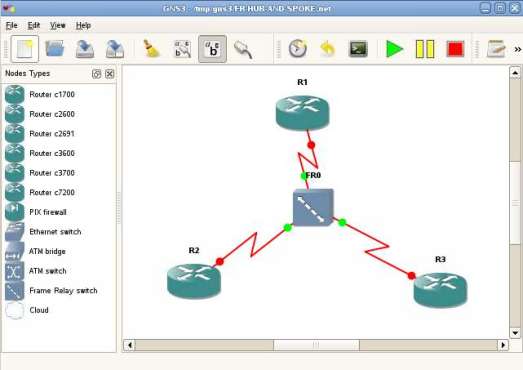
For today, I prepared a presentation about how you can create a Frame-Relay hub and spoke topology in GNS3, save and use it whenever you need it. This tutorial does not include the configuration of the devices which form Frame-Relay hub and spoke, but only the GNS3 lab topology. If you are looking for the tutorial on how to  configure FR hub and spoke on Cisco routers, please refer to my previous tutorial.

The GNS3 lab topology which I’ll create in the following presentation is available for download here. Take the saved lab configuration and open it in your GNS3 software. Before you use it, please have a look inside the file, as there are some lines you suppose to modify to fit your system.

Please click on the image below to see the tutorial:

gns3-fr-hub-spoke

How to monitor IP SLA with free tools

Lately I saw an increasing interest for IP SLA monitor and analyze of the data output. I believe that you already know that you can do IP SLA monitor with a lot of tools from the most expensive ones which include support and assistance to the free ones like MRTG or RRDTOOL. From the statistics that I have, more than 50% of the network engineers interested in this tools have a problem either with the money (low budget or the on and on “we do not have money this year for that investment” ) or making free tools actually work and report accurate data.

Yesterday I received an e-mail from SolarWinds that announce me about their FREE IP SLA monitor tool. Usually I ignore such e-mails as for most of them there is always a catch, but since it was from a company that made me a very good impression over the year by offering exactly what’s specified in the advertisement, I said that I should give it a try. Before I present this to you, let’s make something clear. This is not a commercial post, e.g. post to be pay or another things like that. I do not have time and I don’t want to do such stuff of my blog, but when some product really worth to be tried I think that the development company deserve to be specified.

Since it’s a free tool don’t expect to have all the features of the one which you are paying for it, but compared to the headache of implementing other free tools (MRTG, RRDTOOL) you’ll find this one to be piece of cake. Everybody who has an idea about networking can use this without any problems. Configuration is as simplest as it can be. You have to choose the destination IP or hostname to monitor then pick the monitor service and polish some parameters to your particular network. That’s it! One particular issue to me is that this tool is working only from Windows.

Please have a look below to see how to configure this:

IP SLA monitor tool

GNS3: How-to save multiple topology configurations for good

GNS3 is an extremely useful tool if you are using Dynamips to emulate Cisco devices. It is a graphical environment in which even a newbie can do complex configuration by clicking and dragging routers, switches, connections into a topology that can be saved.

The problem that occurred to me in the past (and maybe to you also) is the following. Let’s assume that we create a configuration with routers named R0 and R1 and you save the topology config and also the routers config (“copy run start”). All the files (GNS3 topology config and Dynamips files created for R0 / R1 saved config) will be put into the default GNS3 project directory (e.g. /tmp in Linux or other directory if you are using Windows system). For now it is perfect. You have everything fine.

Next time when you start a topology, by default GNS3 will start with the same routers R0 and R1, and we you boot them, they will load your ex-saved config files, because GNS3 will look for config files into it’s default project directory, and since the name of the routers are the same, it will think that this have to be loaded. So, what you will do when you have 10 topologies that you save. Give all the time different routers name? Even so you will end with a mess in your default GNS3 project directory.

I have a solution for this issue, that you might like. I’m not saying that I have discovered this solution…for sure there is somewhere out there on the Internet, but I think of it by my own and I said that maybe others will use it.

This how-to assume that you know what Dynamips, GNS3 and Linux (any distribution) are. The same steps can be applied on Windows system also. Please check the tutorial by clicking the image below:
*Note:  As the file is flash and it’s quite big please have patience until it is loaded*

GNS3 topology config save

Dynamips: How to save vlans after switch reload

Most of you already know that in Dynamips after a reload of a switch all the vlans and vtp configurations are gone. There is a way how to save the vlan and vtp configuration even in case of a reload of the switch and I will show you below how to do it. For switch emulator I used a Cisco 3640 IOS image with a NM-16ESW module to have Layer 2 port on the device.

Click below to see the movie and explanation:

How to save vlans after switch reload